Data Analyst | Google Sheets Specialist
0.0
تقييم البائع
التقييمات الإجمالية
(0)
الطلبات المكتملة
(0)
Data analysis
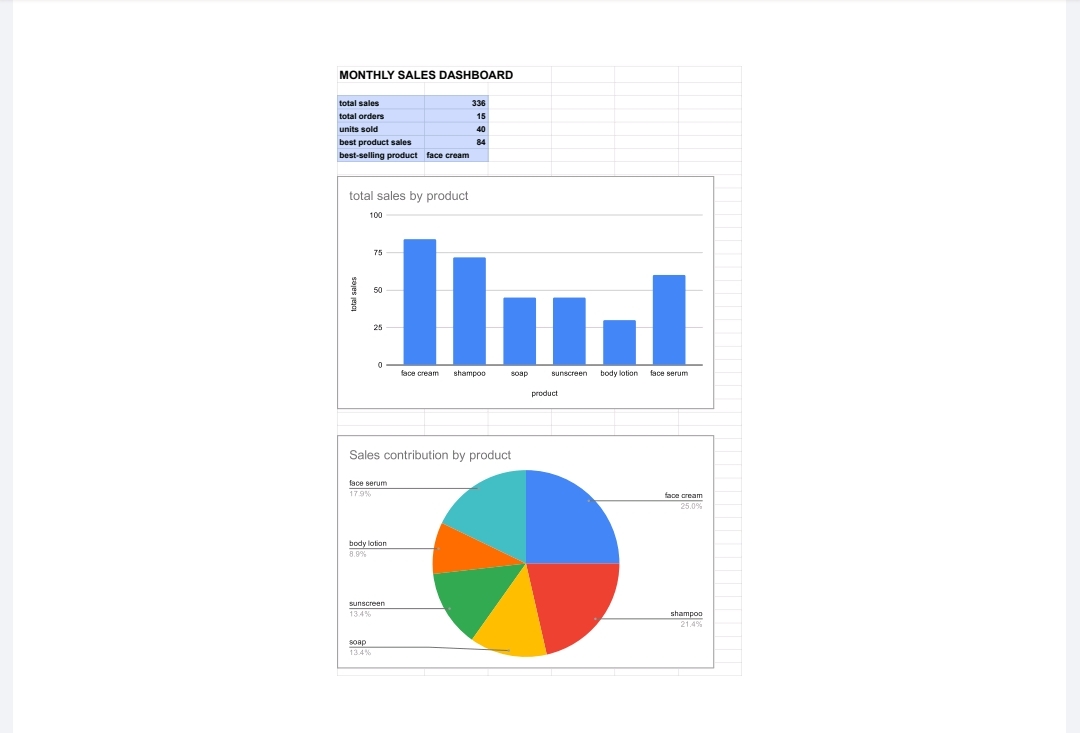
Dashboard Creation, Sales Analysis, and Data Visualization I created an interactive-style sales dashboard using Google Sheets to summarize sales performance and compare product sales. The dashboard includes key performance indicators (KPIs), a sales summary, a column chart comparing total sales by product, and a pie chart showing each product's contribution to total sales. Key results: • Total Sales: 336 • Total Orders: 15 • Units Sold: 40 • Best-Selling Product by Sales Value: Face Cream • Highest Product Sales: 84 Tools used: Google Sheets, spreadsheet formulas, charts, and data visualization. This is a practice project using fictional sample data.
عرض المشروع الأصلي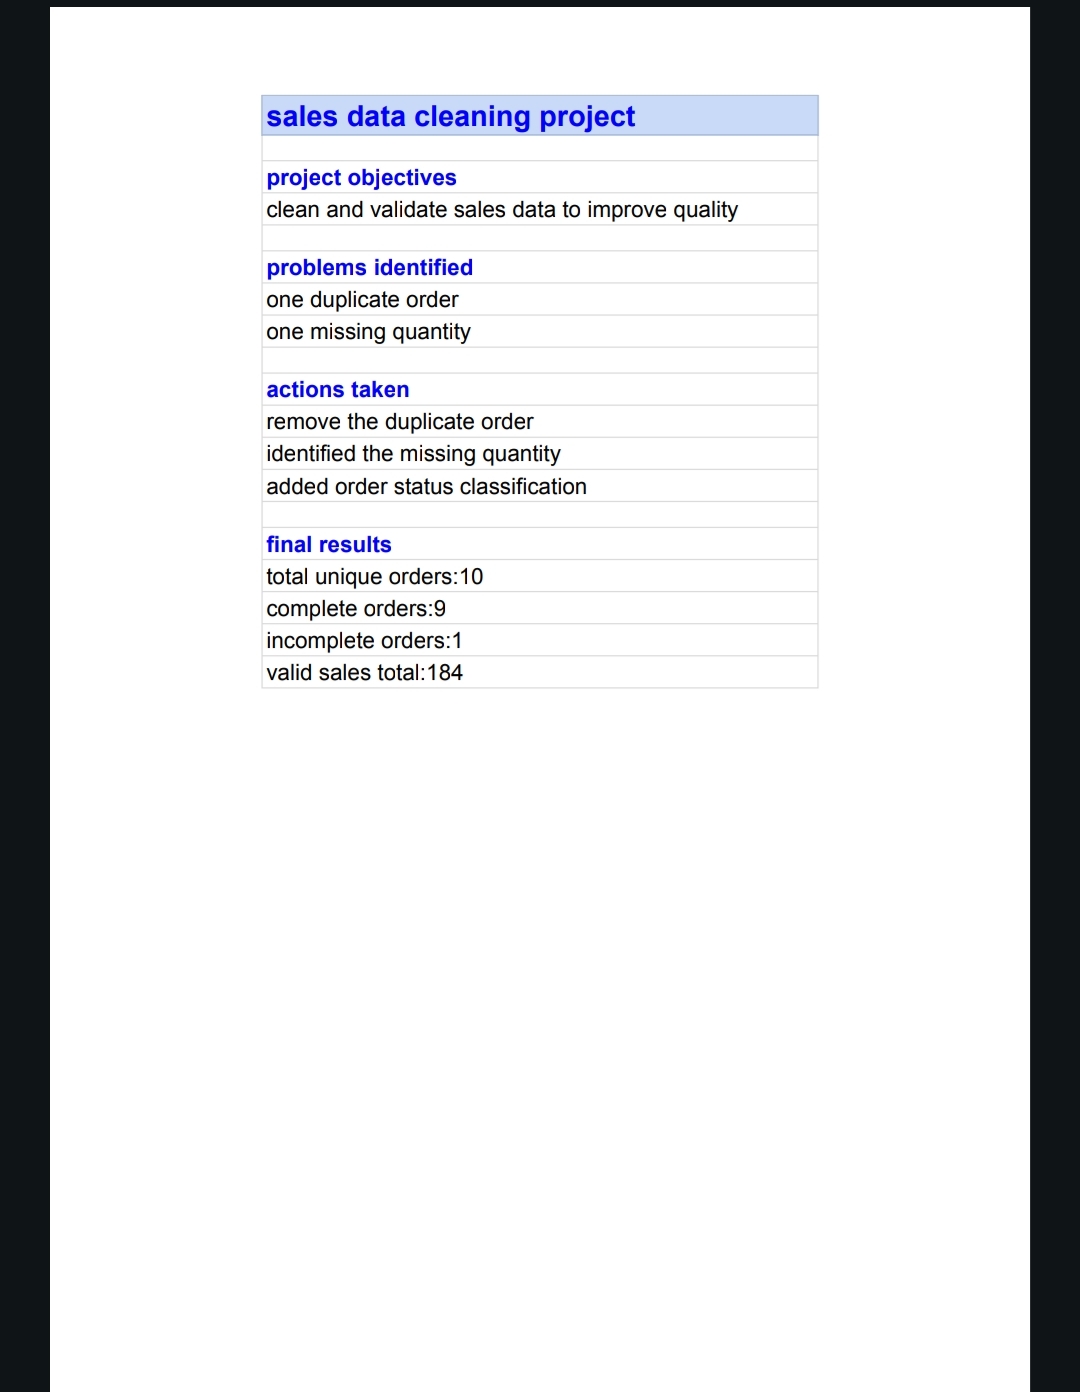
/data analysis/Data mangment / data entry
Data Cleaning and Data Quality Review I cleaned and reviewed a fictional sales dataset using Google Sheets to improve data quality and prepare it for analysis. The project included: • Identifying and removing duplicate records. • Checking for missing values. • Reviewing order completeness. • Using spreadsheet formulas to validate and summarize the data. Key results: • 10 unique orders after removing duplicates. • 9 complete orders. • 1 order with missing quantity. • Total sales value of 184 in the cleaned dataset. Tools used: Google Sheets. This is a practice project using fictional sample data.
Data analysis
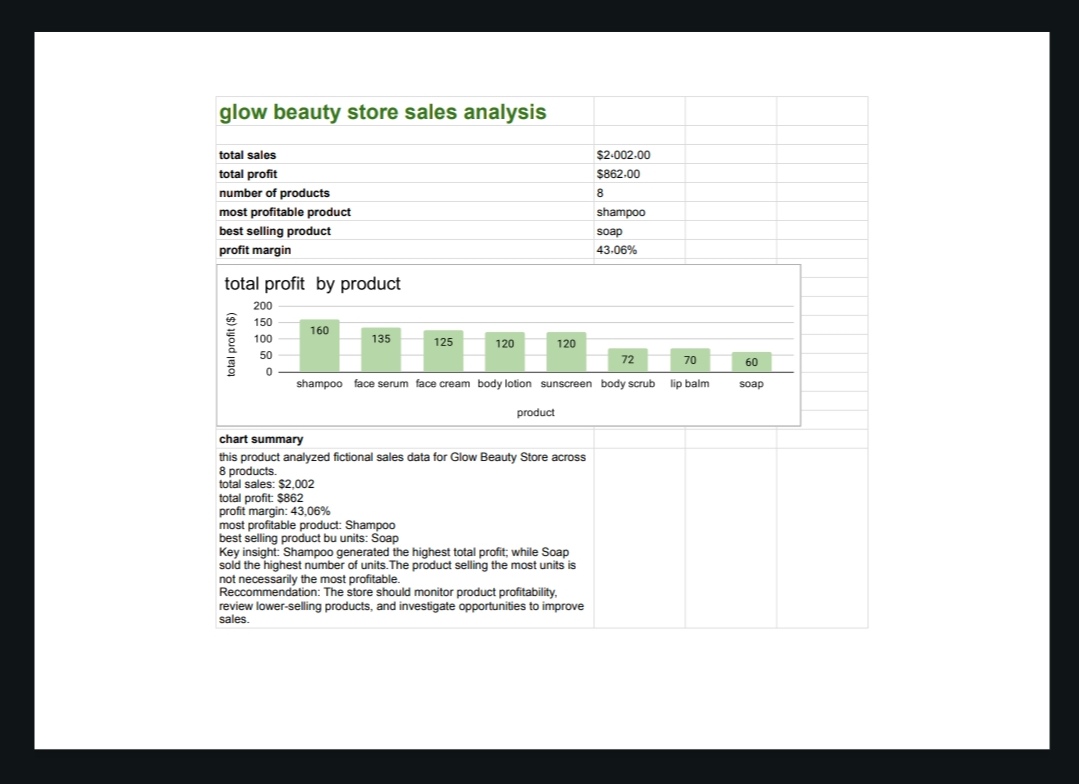
I analyzed fictional sales data for a beauty products store using Google Sheets. The project focused on calculating total sales, total profit, and profit margin, and comparing product performance. Key results: • Total Sales: $2,002 • Total Profit: $862 • Profit Margin: 43.06% • Most profitable product: Shampoo • Best-selling product by units: Soap I also created a chart to visualize total profit by product. This is a practice project using fictional sample data. Data Analyst — Data Analysis and Dashboard Visualization
عرض المشروع الأصلي